Executive Report
Usage
Depending on Vendor data availability the Executive Report may be populated for the weekly, and/or monthly periods. It is suggested to provide data for both the weekly & monthly periods to provide regular metrics as well as a higher level view of the data.
The Executive Report surfaces information on a specific business, so data must be submitted via a seperate call for each of your Accounts.
Example json for each card type is provided below. To submit multiple cards for the target reporting period, multiple anonymous card objects must be included in the report_data array. The entire json string is to be provided raw in the POST body.
Model
There are two separate endpoints, one for each time period. Both endpoints accept data in the exact same format. View the Model, including available ENUM Values in the API Definition
Timing
The report_date is to be provided as the day after the last day of the reporting period. For the weekly frequency, Sat. is the last day of the reporting period, so report_date must be the next Sunday. Example: for the period 2018-09-30 to 2018-10-06 you would submit the report_date as 2018-10-07, and would push this data to the API on the 7th, or as soon as possible afterwards once your data became available. For the monthly freqency report_date will be the first day of the next month(i.e. the first day of the month AFTER the report period).
Submissions are accepted for the current or previous periods, but not for future periods. You may submit at any time during the reporting period, and the data will immediately show up. This is handy for testing purposes, but for production you should submit for your accounts on the report_date itself, or as soon as possible afterward so that you are actually reporting data aggregated over the entire reporting period.
Available Executive Report Cards
Each example below is a single anonymous card template snippit. There is a full example of a payload that you would send for an Account at the bottom of the page.
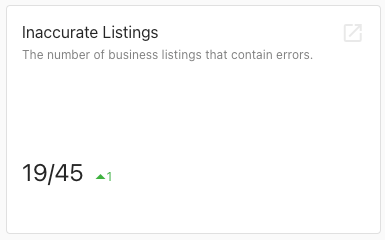
Basic Number & Number With Change Card
The Number With Change Card provides more rich & valuable historical data over the Basic Number card by displaying a value with the change from last period, and where the value was when tracking began. It is highly recommended if the Vendor has the period comparison data to use this card over the Basic.
Example:
{
    "template_type": "NUMBER_WITH_CHANGE",
    "unique_id": "acme_number_1",
    "title": "Inaccurate Listings",
    "description": "The number of business listings that contain errors.",
    "next_url": "https://yourdashboardurl.com/deeplinkpath",
    "width": "HALF",
    "value": "19/45",
    "change": "1",
    "initial_value": "30",
    "format": "FRACTION"
}
Info List Card
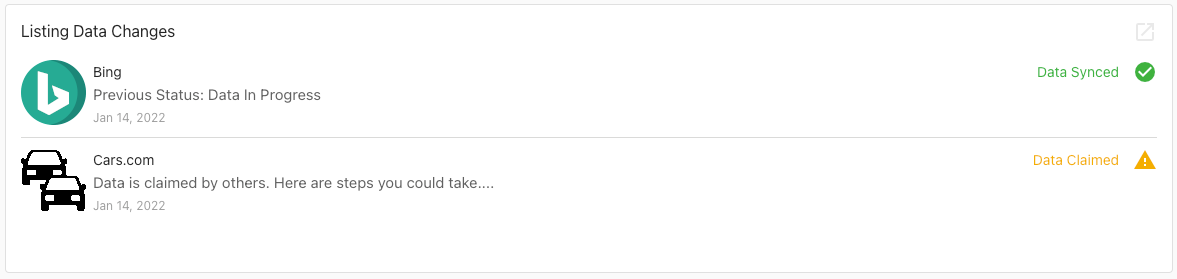
The Info List card is a flexible list card, with an area on the left for an image and text, and coloured text & an Icon on the right hand side.
Example:
{
  "template_type": "INFO_LIST",
  "unique_id": "infolist_1",
  "title": "Listing Data Changes",
  "next_url": "https://yourdashboardurl.com/deeplinkpath",
  "width": "FULL",
  "list": [
    {
        "header": "Bing",
        "body": "Previous Status: Data In Progress",
        "footer": "Jan 14, 2017",
        "info_text": "Data Synced ",
        "info_text_color": "GREEN",
        "info_text_icon": "check_circle",
        "image_url": "https://yourdomain.ca/images/bing.png"
    },
    {
        "header": "Cars.com",
        "body": "Data is claimed by others. Here are steps you could take....",
        "footer": "Jan 14, 2017",
        "info_text": "Data Claimed ",
        "info_text_color": "YELLOW",
        "info_text_icon": "warning",
        "image_url": "https://yourdomain.ca/images/cars.png"
    }
  ]
}
Bar Chart Card
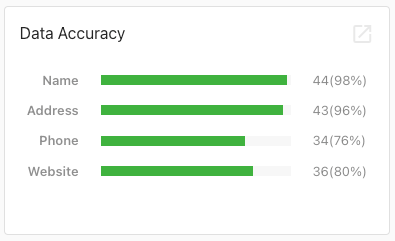
The Bar Chart Card displays a horizontal Bar Chart, with a maximum of 5 bars. Bar values & fill percentage are set independently; this along with the chart values being strings makes this card very flexible. As with the example below if it's desired that the percentages be visable, they could be added to the value string.
Example:
{
  "template_type": "BAR_CHART",
  "unique_id": "acme_bar_1",
  "title": "Data Accuracy",
  "next_url": "https://yourdashboardurl.com/deeplinkpath",
  "width": "HALF",
  "bar_chart": [
      {
        "label": "Name",
        "value": "44(98%)",
        "fill_percent": 98,
        "fill_color": "GREEN"
      },
      {
        "label": "Address",
        "value": "43(96%)",
        "fill_percent": 96,
        "fill_color": "GREEN"
      },
      {
        "label": "Phone",
        "value": "34(76%)",
        "fill_percent": 76,
        "fill_color": "GREEN"
      },
      {
        "label": "Website",
        "value": "36(80%)",
        "fill_percent": 80,
        "fill_color": "GREEN"
      }
  ]
}
Word Cloud Card
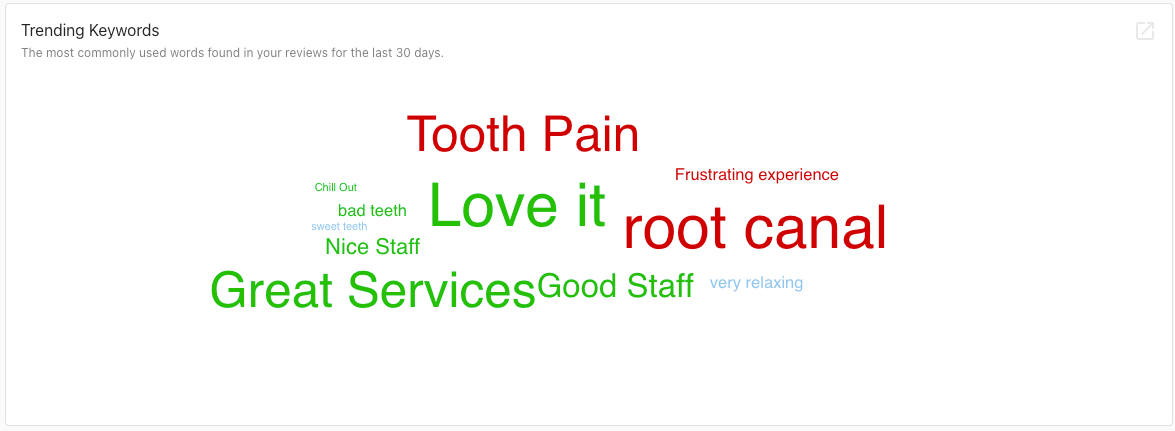
The Word Cloud Card is a dual scale word cloud that displays words and phrases larger or smaller based on a scale from 1-1000, and a sentiment colour scale from 1-1000, which will display the word as red for lower than 400, blue from 400-700, and green for 700+.
Example:
{
  "template_type": "WORD_CLOUD",
  "unique_id": "wordcloud_trending_keyword",
  "title": "Trending Keywords",
  "description": "The most commonly used words found in your reviews for the last 30 days.",
  "next_url": "https://yourdashboardurl.com/deeplinkpath",
  "width": "FULL",
  "word_cloud_list": [
      {
          "sentiment": 900,
          "text": "Love it",
          "weight": 1000
      },
      {
          "sentiment": 550,
          "text": "very relaxing",
          "weight": 220
      },
      {
          "sentiment": 800,
          "text": "Good Staff",
          "weight": 500
      },
      {
          "sentiment": 500,
          "text": "sweet teeth",
          "weight": 80
      },
      {
          "sentiment": 750,
          "text": "Great Services",
          "weight": 770
      },
      {
          "sentiment": 700,
          "text": "Chill Out",
          "weight": 90
      },
      {
          "sentiment": 750,
          "text": "bad teeth",
          "weight": 225
      },
      {
          "sentiment": 400,
          "text": "Tooth Pain",
          "weight": 800
      },
      {
          "sentiment": 200,
          "text": "root canal",
          "weight": 950
      },
      {
          "sentiment": 5,
          "text": "Frustrating experience",
          "weight": 180
      },
      {
          "sentiment": 780,
          "text": "Nice Staff",
          "weight": 300
      }
  ]
}
Line Graph Card
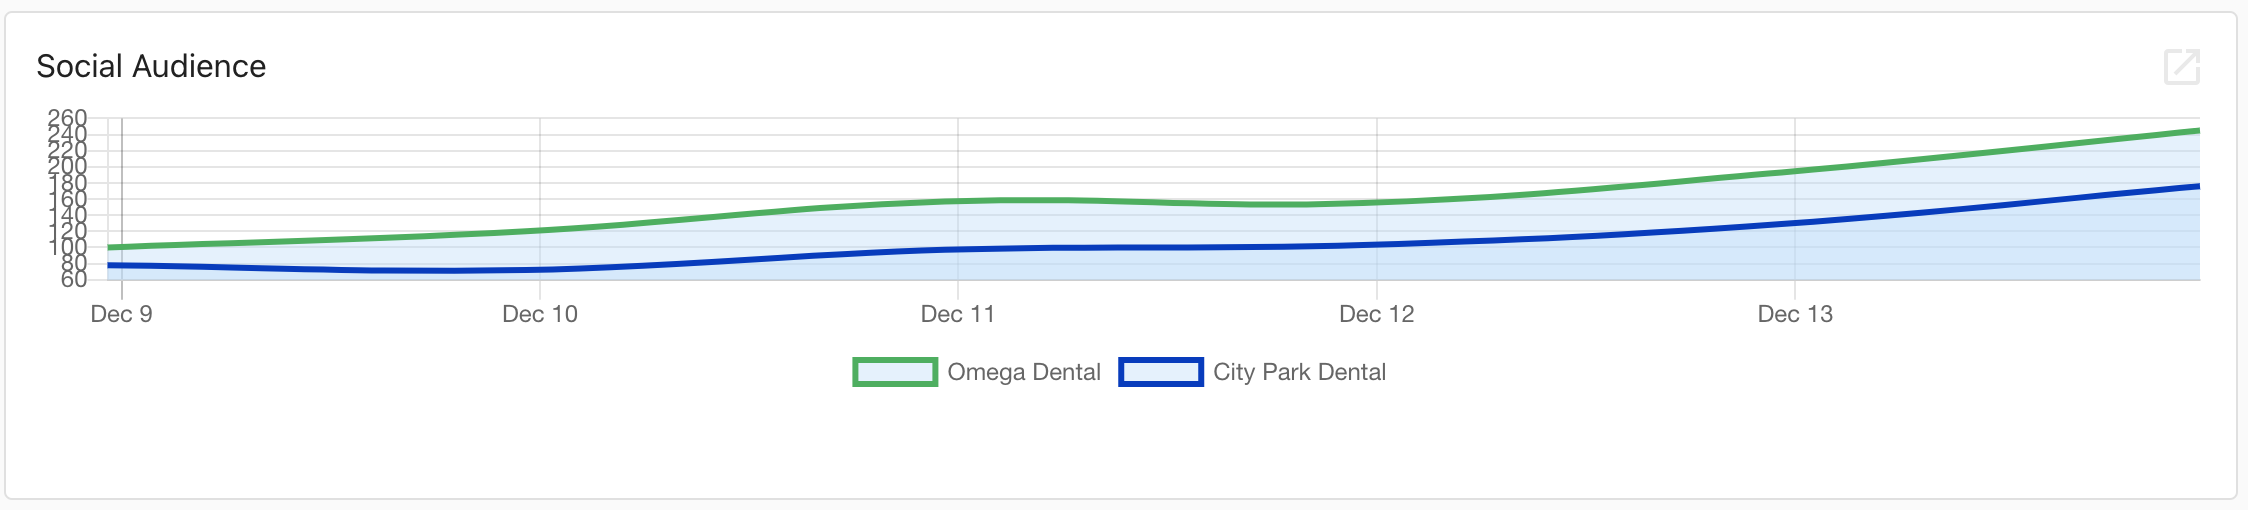
Displays a line graph of progress over time. The x axis values are to be provided as milliseconds since epoch, and the chart will auto scale based on the times provided. Multiple lines are supported - add additional anonymous line objects to the line_graph array.
Example:
{
  "template_type": "LINE_GRAPH",
  "unique_id": "linegraph_social_twitter",
  "title": "Social Audience",
  "next_url": "https://yourdashboardurl.com/deeplinkpath",
  "width": "FULL",
  "line_graph": [
      {
          "label": "Omega Dental",
          "point": [
              {
                  "x": 1670540481000,
                  "y": 100.0
              },
              {
                  "x": 1670626881000,
                  "y": 120.0
              },
              {
                  "x": 1670713281000,
                  "y": 157.0
              },
              {
                  "x": 1670799681000,
                  "y": 155.0
              },
              {
                  "x": 1670886081000,
                  "y": 193.0
              },
              {
                  "x": 1670972481000,
                  "y": 245.0
              }
          ]
      },
      {
          "label": "City Park Dental",
          "point": [
              {
                  "x": 1670540481000,
                  "y": 78.0
              },
              {
                  "x": 1670626881000,
                  "y": 72.0
              },
              {
                  "x": 1670713281000,
                  "y": 97.0
              },
              {
                  "x": 1670799681000,
                  "y": 103.0
              },
              {
                  "x": 1670886081000,
                  "y": 129.0
              },
              {
                  "x": 1670972481000,
                  "y": 176.0
              }
          ]
      }
  ]
}
Call to Action Card
The call to action card displays a message along with a prominant button to direct the user to a location where they can act on the CTA. Example:
{
  "template_type":"CALL_TO_ACTION",
  "description":"Activate Google Business Profile Insights to discover how people interact with Tyra's Total Automotive, Inc online. Understand how people are finding you, where they're coming from, and how many of them are clicking on your phone number! Once your GMB account is connected, you will be able to view online business insights on your next report.",
  "title":"Unlock Google Business Profile Insights",
  "width":"FULL",
  "next_url_label":"Connect Account",
  "next_url":"/edit/account/AG-PR8S4ZHN/google-insights/",
  "unique_id":"cta_gbp_connect"
}

Testing
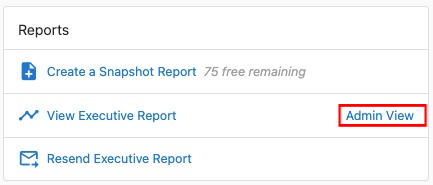
Like most Marketplace Product features, the Executive Report resides in the Business App. From the Account Details page in Partner Center, you can select 'Admin View' in the Reports tile to access the report directly:
Tests should show up in the submitted time period's report very shortly after submission.
Submit tests for the previous period, whether monthly or weekly. If you are submitting tests for the current period they won't show up in the date selector(found at the top right of the screen) as that period has not yet been released.
Example of a full payload
{
   "category":"WEBSITE",
   "account_id":"AG-RN53F9WD",
   "report_date":"2021-07-25",
   "report_data":[
      {
         "template_type":"NUMBER_WITH_CHANGE",
         "unique_id":"acme_number_1",
         "title":"Inaccurate Listings",
         "description":"The number of business listings that contain errors.",
         "next_url":"https://yourdashboardurl.com/deeplinkpath",
         "width":"HALF",
         "value":"19/45",
         "change":"1",
         "initial_value":"30",
         "format":"FRACTION"
      },
      {
         "template_type":"INFO_LIST",
         "unique_id":"infolist_1",
         "title":"Listing Data Changes",
         "next_url":"https://yourdashboardurl.com/deeplinkpath",
         "width":"FULL",
         "list":[
            {
               "header":"Bing",
               "body":"Previous Status: Data In Progress",
               "footer":"Jan 14, 2021",
               "info_text":"Data Synced ",
               "info_text_color":"GREEN",
               "info_text_icon":"check_circle",
               "image_url":"https://yourdomain.ca/images/bing.png"
            },
            {
               "header":"Cars.com",
               "body":"Data is claimed by others. Here are steps you could take....",
               "footer":"Jan 14, 2021",
               "info_text":"Data Claimed ",
               "info_text_color":"YELLOW",
               "info_text_icon":"warning",
               "image_url":"https://yourdomain.ca/images/cars.png"
            }
         ]
      },
      {
         "template_type":"BAR_CHART",
         "unique_id":"acme_bar_1",
         "title":"Data Accuracy",
         "next_url":"https://yourdashboardurl.com/deeplinkpath",
         "width":"HALF",
         "bar_chart":[
            {
               "label":"Name",
               "value":"44(98%)",
               "fill_percent":98,
               "fill_color":"GREEN"
            },
            {
               "label":"Address",
               "value":"43(96%)",
               "fill_percent":96,
               "fill_color":"GREEN"
            },
            {
               "label":"Phone",
               "value":"34(76%)",
               "fill_percent":76,
               "fill_color":"GREEN"
            },
            {
               "label":"Website",
               "value":"36(80%)",
               "fill_percent":80,
               "fill_color":"GREEN"
            }
         ]
      },
      {
         "template_type":"WORD_CLOUD",
         "unique_id":"wordcloud_trending_keyword",
         "title":"Trending Keywords",
         "description":"The most commonly used words found in your reviews for the last 30 days.",
         "next_url":"https://yourdashboardurl.com/deeplinkpath",
         "width":"FULL",
         "word_cloud_list":[
            {
               "sentiment":900,
               "text":"Love it",
               "weight":1000
            },
            {
               "sentiment":550,
               "text":"very relaxing",
               "weight":220
            },
            {
               "sentiment":800,
               "text":"Good Staff",
               "weight":500
            },
            {
               "sentiment":500,
               "text":"sweet teeth",
               "weight":80
            },
            {
               "sentiment":750,
               "text":"Great Services",
               "weight":770
            },
            {
               "sentiment":700,
               "text":"Chill Out",
               "weight":90
            },
            {
               "sentiment":750,
               "text":"bad teeth",
               "weight":225
            },
            {
               "sentiment":400,
               "text":"Tooth Pain",
               "weight":800
            },
            {
               "sentiment":200,
               "text":"root canal",
               "weight":950
            },
            {
               "sentiment":5,
               "text":"Frustrating experience",
               "weight":180
            },
            {
               "sentiment":780,
               "text":"Nice Staff",
               "weight":300
            }
         ]
      },
      {
        "template_type": "LINE_GRAPH",
        "unique_id": "linegraph_social_twitter",
        "title": "Social Audience",
        "next_url": "https://yourdashboardurl.com/deeplinkpath",
        "width": "FULL",
        "line_graph": [
            {
                "label": "Omega Dental",
                "point": [
                    {
                        "x": 1670540481000,
                        "y": 100.0
                    },
                    {
                        "x": 1670626881000,
                        "y": 120.0
                    },
                    {
                        "x": 1670713281000,
                        "y": 157.0
                    },
                    {
                        "x": 1670799681000,
                        "y": 155.0
                    },
                    {
                        "x": 1670886081000,
                        "y": 193.0
                    },
                    {
                        "x": 1670972481000,
                        "y": 245.0
                    }
                ]
            },
            {
                "label": "City Park Dental",
                "point": [
                    {
                        "x": 1670540481000,
                        "y": 78.0
                    },
                    {
                        "x": 1670626881000,
                        "y": 72.0
                    },
                    {
                        "x": 1670713281000,
                        "y": 97.0
                    },
                    {
                        "x": 1670799681000,
                        "y": 103.0
                    },
                    {
                        "x": 1670886081000,
                        "y": 129.0
                    },
                    {
                        "x": 1670972481000,
                        "y": 176.0
                    }
                ]
            }
        ]
      },
      {
         "template_type":"CALL_TO_ACTION",
         "description":"Activate Google My Business Insights to discover how people interact with Tyra's Total Automotive, Inc online. Understand how people are finding you, where they're coming from, and how many of them are clicking on your phone number! Once your GMB account is connected, you will be able to view online business insights on your next report.",
         "title":"Unlock Google My Business Insights",
         "width":"FULL",
         "next_url_label":"Connect Account",
         "next_url":"/edit/account/AG-PR8S4ZHN/google-insights/",
         "unique_id":"cta_gmb_connect"
      }
   ]
}